

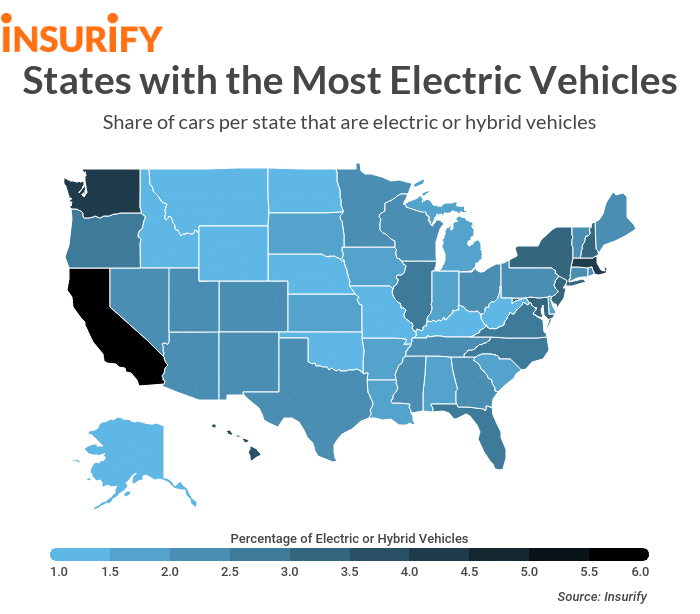
Electric Driving: States with the Most Hybrid or Electric Vehicles
Electric and electric hybrid vehicles—and their environmentally friendly nature—are rapidly becoming more popular. Here’s a look at which states are leading that trend.
It used to be that the only way to refuel your car was to make a stop at the local gas station, where gas prices fluctuate daily and the odor is less than pleasant. Nowadays, however, electric vehicles provide a better-smelling and more environmentally conscious alternative. It’s even easier to restock the car’s energy stores. You can install a charging station in your garage, saving you all those trips to the gas station.
Electric vehicles aren’t even niche anymore. They’re quickly becoming more and more popular, as companies like Tesla, Toyota, and Chevrolet continue to pump out newer versions of their trademarked fuel-less cars.
To examine this increase in popularity, the data science team at Insurify, an auto insurance quotes comparison website, decided to crunch the numbers to determine which states are at the forefront of the electric vehicle surge. Below is a look at which states have the highest proportion of hybrid and electric cars.
Insights
- National averages. Nationwide, 2.28 percent of cars were electric or hybrid vehicles. Furthermore, the average price of regular gas as of late June was $2.67, and the national average for number of miles driven per day is 36.89 miles.
- A coastal trend. The closer you get to the water, the more likely you are to see electric cars. Nine of the ten states on the list are on one of the U.S’s two coasts—four on the West and five on the East. The lone exception resides in the Midwest.
- Gas prices may have some effect. Remarkably, eight of the ten states discussed below have gas prices above the national average. The data also shows a moderate positive correlation between the percentage of car owners that drive an electric or hybrid vehicle and the price of regular gas by state. Of course, in these areas the cost of living—as well as wages—are higher. These higher wages may allow more drivers to purchase an electric car—which is usually more expensive than a normal car.
- Urban areas well represented. The three biggest cities in the country by population all reside in states that crack our top 10. In fact, seven of the 20 most populous cities in the U.S. are in states with a high proportion of electric or hybrid vehicles.
Methodology
In order to figure out which states had the highest percentage of electric and hybrid electric vehicles, the data scientists at Insurify, a website to compare insurance quotes, dived into their database of over 1.6 million car insurance applications. Applicants enter personal and vehicle information, as well as information about their driving history, including the type of car they drive. The number of hybrid/electric vehicles in each state was analyzed against the total number of cars to determine the proportion of hybrid/electric vehicles in each state. The top 10 states were then selected. Statistics on gas prices were obtained from AAA on June 25, 2019. Finally, figures on how many miles people drive per day were obtained from a study done from the years 2011-2014 by the U.S. Department of Transportation Federal Highway Administration (FHWA).

10. Illinois
- Percentage of vehicles that are hybrid or electric: 2.73%
- Average regular gas price: $2.84
- Average miles driven per day per licensed driver: 35.37
Illinois is the only state in the top 10 that doesn’t hug either the Atlantic or Pacific oceans, though it does have the third most populous urban area in the country: Chicago. Despite that, the Prairie State does rank below the national average for miles driven per day per licensed driver, which is perhaps in part due to the Windy City’s extensive public transport system. The “L” has the second-most weekly riders of any mass transit system in the country, behind only the New York City subway.
9. Oregon
- Percentage of vehicles that are hybrid or electric: 2.82%
- Average regular gas price: $3.23
- Average miles driven per day per licensed driver: 38.41
The first of four western states on this countdown, Oregon isn’t very friendly to drivers who own traditional cars. It’s regular gas prices rank sixth-highest in the country. To make matters worse, the 38.41 miles driven per day is third-highest amongst states on this list. Oregon is making up for it, though, with an electric vehicle rebate program that recently went into effect. Drivers in the Beaver State can earn up to $12,500 back when purchasing a new electric car.
8. New Jersey
- Percentage of vehicles that are hybrid or electric: 3.00%
- Average regular gas price: $2.75
- Average miles driven per day per licensed driver: 32.65
New Jersey is the only state in the country where self-service gas stations are still illegal, but the added convenience of drivers not having to pump their own gas hasn’t kept people from buying electric cars. NJ still has the eighth-highest percentage of drivers with electric or hybrid electric cars. It does still have gas prices above the national average, though, and a mean driving distance per day over four miles fewer than average.
7. New York
- Vehicles that are hybrid or electric: 3.08%
- Average regular gas price: $2.84
- Average miles driven per day per licensed driver: 32.50
New York has the third-fewest average miles driven per day out of the 10 states on the list, a fact which can likely be partially attributed to its massive public transportation system, the biggest in the country. Throw in gas prices above the national average, as well as the famous New York City traffic, and it’s not surprising that drivers there choose to stay off the streets. When drivers in the city and upstate do choose to hit the roads, though, there’s a significant proportion of electric vehicles involved. Only six states have a higher percentage of hybrid or electric cars.
6. Maryland
- Vehicles that are hybrid or electric: 3.18%
- Average regular gas price: $2.58
- Average miles driven per day per licensed driver: 40.61
Maryland, which comes in at the number six spot on the list and is one of five states on the east coast in the top 10, sports the highest average miles driven per day of any state on this list. At least it’s not all bad for drivers there, though, as its average regular gas price of $2.58 checks in below the country-wide mean by nine cents.
5. New Hampshire
- Vehicles that are hybrid or electric: 3.35%
- Average regular gas price: $2.55
- Average miles driven per day per licensed driver: 35.40
New Hampshire’s gas prices are even better than Maryland’s. Customers in the Granite State pay just $2.55 per gallon, least out of any state on this list, and 20th lowest nationally. In spite of that, gas-powered cars are less popular in New Hampshire than they are nationwide. Its proportion of hybrid/electric vehicles is nearly 50 percent greater than the national share. New Hampshire also had the fourth-fewest carbon emissions of any state in the country.
4. Hawaii
- Vehicles that are hybrid or electric: 3.86%
- Average regular gas price: $3.64
- Average miles driven per day per licensed driver: 30.40
Best known for its sandy beaches and tropical weather, Hawaii is also quickly becoming a paradise for electric vehicle owners, sliding in at the number four spot on the top 10. People there don’t drive very often—its average miles per day driven is the lowest of any state on this list—but when Hawaii drivers do hit the road in a traditional vehicle, its expensive. Gas there will cost customers an average of $3.64 a gallon, making it the second-most expensive gas in the country. It’s no wonder there’s such a high proportion of drivers that own an electric or hybrid car.
3. Washington
- Vehicles that are hybrid or electric: 4.09%
- Average regular gas price: $3.36
- Average miles driven per day per licensed driver: 35.14
Owning an electric vehicle in Washington is already beneficial, as the gas prices there are third-highest in the country, but life just got better again for non-gas car owners. The state legislature recently announced the revival of a sales tax break for any consumer that buys an electric vehicle that will be present for the next six years.
2. Massachusetts
- Vehicles that are hybrid or electric: 4.46%
- Average regular gas price: $2.70
- Average miles driven per day per licensed driver: 32.19
The Bay State, however, doesn’t follow in Washington’s footsteps. Massachusetts does have a program to provide buyers of electric cars with tax rebates, but that program is set to expire in September 2019 when the funding runs out. Despite that, since 2014 more than 14,000 electric vehicles have been sold in Massachusetts. This helps explain why 4.46 percent of vehicles there—a figure which is nearly double the national average—are electric or hybrid.
1. California
- Vehicles that are hybrid or electric: 5.97%
- Average regular gas price: $3.74
- Average miles driven per day per licensed driver: 39.52
It’s only fitting that California, the home of Tesla—which sells the highest quantity of electric vehicles of any brand—has the highest proportion of electric or hybrid cars of any state on the list. One potential reason non-gas vehicles are so attractive? In California, gas costs $3.74 a gallon on average, which makes it the most expensive gas of any of the 50 states. Despite the high gas prices, the average resident still drives nearly 40 miles a day, second-most of any state on this list.
More From KYYW 1470


